The full report with many graphs is here. Here’s the highlights. Put on your science hat before you read this! And check your well (links included)!
The memo has more details, here’s the highlights. I’m surprised they would only test the wells once a year given all the interest and changing landscape around these chemicals. Also, for reference, here’s a map that shows where all the wells are. You can check the water quality of the well serving your address here. You could also try to read the report if you’re feeling all science-y and want more details. Mine well said nothing about PFAS chemicals. Also, remember the county has a new website for PFAS information.
Background
In February, the Water Utility Board directed staff to commence with PFAS [per- and polyfluoroalkyl substance] testing at all Madison wells using a modified EPA method capable of detecting a minimum of 24 PFAS with reporting limits in the low single-digit part per trillion range. This new requirement expanded PFAS monitoring beyond monthly testing at Well 15 – a well significantly impacted by PFAS contamination – and the more limited monitoring at wells presumably susceptible to contamination. The directive increased the number of PFAS evaluated from six to at least two dozen.
In preparing the monitoring plan, Madison wells were categorized by potential PFAS contamination risk based on well construction and proximity to known or suspected PFAS sources. Those classified among the most vulnerable included multi-aquifer wells with previous detections of organic contaminants such as PCE [tetrachloroethylene] or 1,4-dioxane.
Two private laboratories were already under contract to perform the analysis and so they continued to do this work. In addition, the Wisconsin State Laboratory of Hygiene was developing its capacity for PFAS analysis and working toward lab certification for EPA Method 537.1, the only EPA-approved standard method for PFAS analysis. Scientists from the state lab offered to collect and analyze samples, including field blanks, at no charge to the utility. Sample collection began in earnest during March and April, with all wells except the seasonal wells sampled during this period. Testing of the seasonal wells concluded in September.
This report summarizes the results of our 2019 PFAS monitoring and makes recommendations for future PFAS monitoring.
Monitoring Results Summary & Analysis
Of the twenty-three Madison wells tested, fourteen showed the presence of at least one PFAS while nine wells were free of all PFAS tested. Of the nine wells with no PFAS detections, six had been tested for 30 PFAS while the remaining three wells were tested for 24 PFAS.
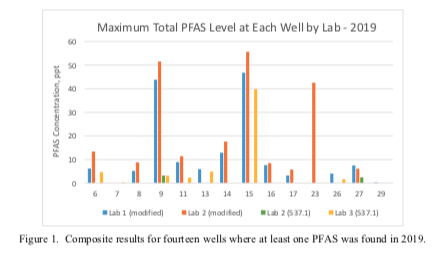
The highest concentrations of total PFAS were found at Well 15 (56 ppt), Well 9 (52 ppt), and Well 23 (43 ppt) – see Figure 1. At other wells, most PFAS detections were too low to quantify accurately and, therefore, were reported by the laboratory as estimated values. At six wells, this estimated total PFAS level ranged from 2 to 10 ppt while at the remaining three wells the estimated PFAS level was between 10 and 20 ppt.
Combined PFOA + PFOS levels at all wells were below 20 ppt, the groundwater enforcement standard recently proposed by the Wisconsin Department of Health Services. The highest PFOA + POS level is found at Well 15 where it measured 12 ppt. The next highest level was 6.6 ppt at Well 23, a seasonal well that has not delivered water to the system since 2017 due to other water quality concerns.
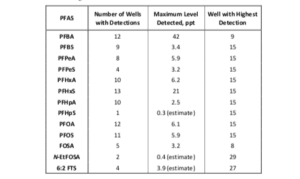
Individual PFAS rarely occur in isolation; more often, a mixture of six or more PFAS were found. The PFAS most commonly detected in Madison wells included PFHxS, PFOA, PFBA, PFOS, PFHxA, and PFHpA – see Table 1. A single PFAS chemical – PFHxS and N-EtFOSA – was found at Wells 7 and 29, respectively, at levels estimated at 0.4 parts per trillion (ppt).
Figures 3 through 14 show the range of results for each PFAS chemical detected at a well by at least one laboratory. For example, Figure 3 shows that water from Well 6 was tested by one lab in March and by three labs in April including the same lab that tested the March sample. PFHxS was detected in all four samples at levels ranging from 2.8 to 4.5 ppt. If an individual PFAS was not detected by that laboratory, an empty bar with dashed outlines depicts the detection limit for that PFAS. Figure 3 shows that PFHxA was detected by Labs 2 and 3 at levels ranging from 0.7 to 1.3 ppt; however, PFHxA was not detected by Lab 1 where the detection limit was 8.8 ppt. Table 2 presents a complete list of the method detection and reporting limits for all three laboratories.
A comparison of how individual PFAS test results vary across Madison wells is depicted in Figures 15 through 17. For example, Figure 16b shows that PFHxS was detected at thirteen wells and Well 15 has the highest level at around 20 ppt. However, most wells in which PFHxS was present tested at 1-5 ppt. It should be noted that Figures 15 through 17 report estimated values (measurements between the detection limit and the method reporting limit, and depicted by orange bars) in addition to the more reliable results that test above the method reporting limit (blue bars).
Figure 17d compares the results for FOSA and 6:2 FTS. It is noteworthy that for both PFAS each was detected only during one sampling event, detected only by a single laboratory, and the PFAS was also detected in the method blank. Further, the figure shows the detection limits from previous or subsequent samples in which the PFAS was not found. While we are reporting the results, some uncertainty remains as to whether they are reliable or reflect lab contamination. The ubiquitous nature of PFAS and inherent challenges with ultra-trace chemical analysis leads to a healthy skepticism regarding the validity of test results especially in the low or sub part per trillion range. Nevertheless, routine monitoring in the future is expected to diminish this uncertainty as patterns begin to emerge with more data points.
Finally, not surprisingly, PFAS affected more multi-aquifer wells than confined aquifer wells. Ten of the fourteen multi-aquifer wells were impacted by PFAS with seven having at least eight PFAS present. The three remaining wells had between four and six PFAS present. Only two of nine confined aquifer wells had more than a single PFAS present. Although well construction provides some level of protection, it alone does not eliminate the risk from PFAS contamination of drinking water.
Recommendations for Future Testing
The Water Utility has gained important experience with PFAS analytical methods and, in particular, challenges associated with accurately measuring low levels of ultra-trace contaminants such as PFAS in drinking water. While EPA Method 537.1 is the standard method for measuring PFAS in drinking water, the method proved inadequate for quantifying the full range of PFAS present in Madison wells.
Recommendations for future PFAS testing include:
• Test all Madison wells at least once in 2020.
• Select a single laboratory for future testing to standardize the analytical methodology and allow for time-related comparisons.
• Consistently use the same modified EPA Method 537 for all PFAS analysis to facilitate detection of a wider range of PFAS than EPA Method 537.1.
• Use EPA Method 537.1 if directed by US EPA or Wisconsin DNR unless the modified method has been designated an “equivalent or better” method for PFAS analysis in drinking water.


